Organizational Network Analysis: Complete Guide to Mapping Workplace Networks
September 15, 2025Picture this. Your organization chart shows a neat hierarchy with clear reporting lines, but the real work happens through invisible connections that don't appear on any official diagram. A software engineer turns to a designer three departments over for quick feedback. A mid-level manager becomes the go-to person for strategic insights across multiple teams. A seemingly junior employee holds the key relationships that keep cross-functional projects moving.
Picture this. Your organization chart shows a neat hierarchy with clear reporting lines, but the real work happens through invisible connections that don’t appear on any official diagram. A software engineer turns to a designer three departments over for quick feedback. A mid-level manager becomes the go-to person for strategic insights across multiple teams. A seemingly junior employee holds the key relationships that keep cross-functional projects moving.
Welcome to the world of organizational network analysis (ONA), a powerful method that reveals how work actually gets done in your organization. While traditional org charts show us who reports to whom, ONA uncovers the hidden patterns of collaboration, influence, and information flow that determine whether your organization thrives or struggles.
This comprehensive guide will explain what ONA is and how to harness its power to transform your organization’s performance.
What is Organizational Network Analysis (ONA)?
In very simple terms, ONA shows who’s friends with whom in a workplace. Of course, for leaders and organizations, it is far more advanced. It’s a scientific approach to mapping and analyzing the relationships, connections, and interactions between people in your organization.
At its core, ONA reveals how information flows, how people collaborate and connect, and what kind of silos, bottlenecks, and influencers exist within your organization. It sheds light on the informal hierarchy, informal leaders, and informal structures that every company has.
Modern ONA goes beyond simple relationship mapping. It combines multiple data sources, from communication platforms like Slack and Teams to calendar data and even survey responses, to create a comprehensive picture of organizational dynamics. The result is actionable insights that help leaders identify opportunities and optimize performance at both individual and organizational levels.
Consider this real scenario. A manager might not be the best person to reach their team as they have only been with the company for three months and haven’t proven themselves yet. Instead, the team might be more reliant on a senior employee who’s been there from day one. ONA can reveal these hidden dynamics.
Discover Your Hidden Networks
Understand how work really gets done and who are the key influences in your organization.
The 3% Rule: Your Organization’s Internal Influencers
In every social group, some people have more connections and influence than others. If you focus on the 3% of individuals with the most connections, you can typically reach 75% to 85% of the entire organization through that small group.
These super-connectors aren’t necessarily the highest-ranking people on your org chart. They’re the individuals who naturally build bridges between different groups, departments, and levels of hierarchy.
Why Super-Connectors Matter More Than Traditional Hierarchy
The difference between positional power and network influence is profound. A VP might have formal authority over 200 people, but if they’re not well-connected across the organization, their ability to drive change is limited. Meanwhile, a mid-level employee who knows people across multiple departments can influence outcomes far beyond their official role.
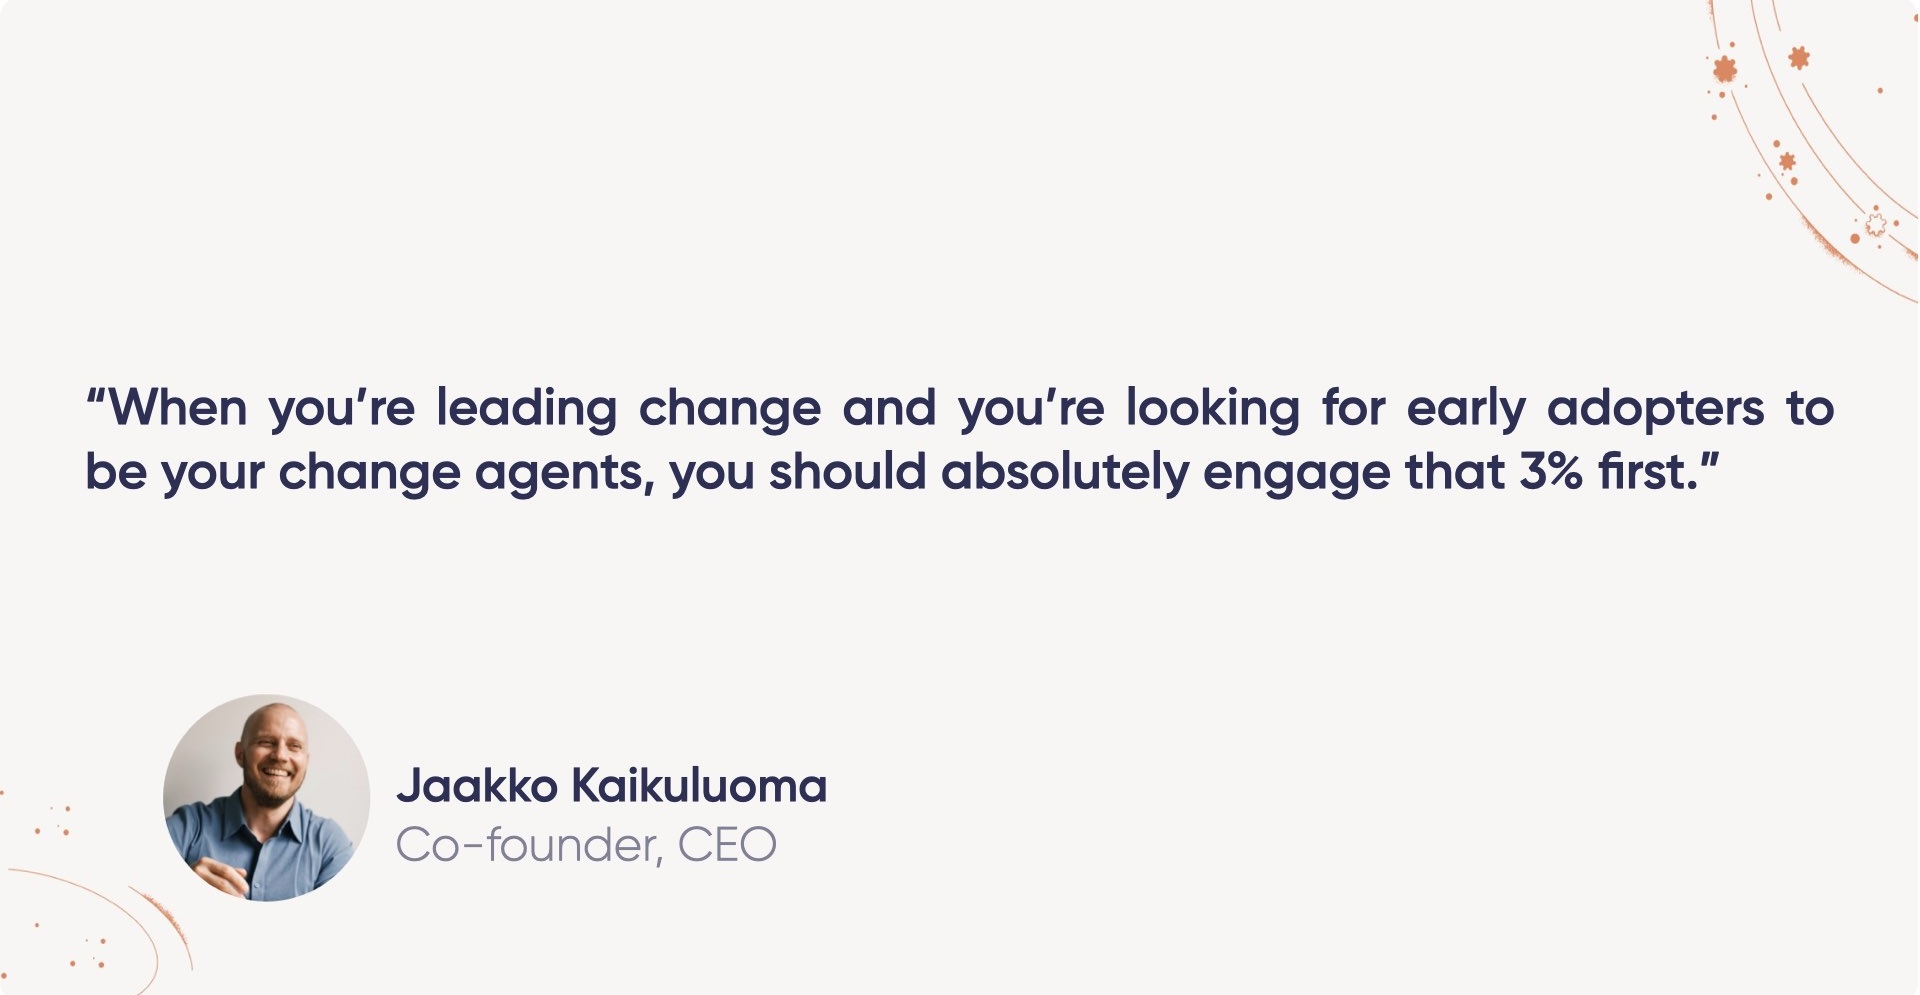
When you’re leading change, you should absolutely engage that critical 3% first. These internal influencers will pull the rest of the organization with them because they have both high influence and high connectivity. They’re the single points where the whole organizational network moves.
Identifying Your Organization’s Critical Connectors
We can identify these super-connectors by analyzing multiple data streams, such as Slack, Google Calendars, Outlook, and Microsoft Teams. We then calculate the connection strength between each person in the network and identify those with both a high degree (lots of connections) and high influence (central position in the network). These are the individuals whom the rest of the organization is likely to listen to.
What Happens When Super-Connectors Leave
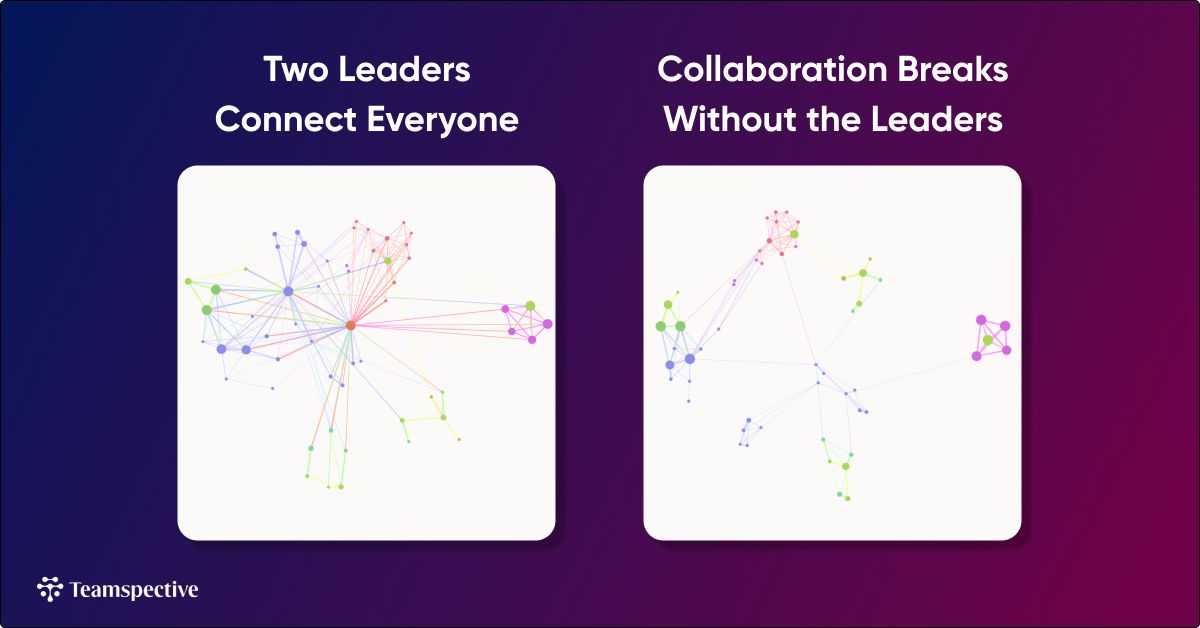
Ask yourself, if two key people left tomorrow, would your network still function or fall apart? I’ve studied this exact risk in many organizations and seen how losing just one or two central connectors can fragment communication, slow decision-making, and increase turnover risk.
Removing just two individuals from the network can leave whole departments disconnected, a common vulnerability in newly established business units, organizations entering new markets, and founder-led companies where key relationships haven’t been systematically developed.
This is like a fabric that loses one thread. When you pull that fabric, the hole gets bigger and bigger, all because that one critical person left. The organizational impact can be devastating, affecting everything from project timelines to employee morale.
Why ONA Matters for Modern Leaders
The business case for ONA has never been stronger. According to Gartner’s 2025 HR priorities survey, 75% of HR leaders report that managers are overwhelmed and not equipped to lead change, culture, team development, and employee engagement. This management crisis directly connects to collaboration challenges that ONA can help address.
The Collaboration Crisis
Modern organizations face unprecedented collaboration challenges due to hybrid and remote setups, different cultural and socio-economic backgrounds, and more. These challenges manifest in several ways:
- Slow performance management cycles
- Inefficient cross-functional collaboration
- Lack of proactive team development by managers
- Non-systematic leadership development
- Low psychological safety
Hidden Bottlenecks That Damage Performance
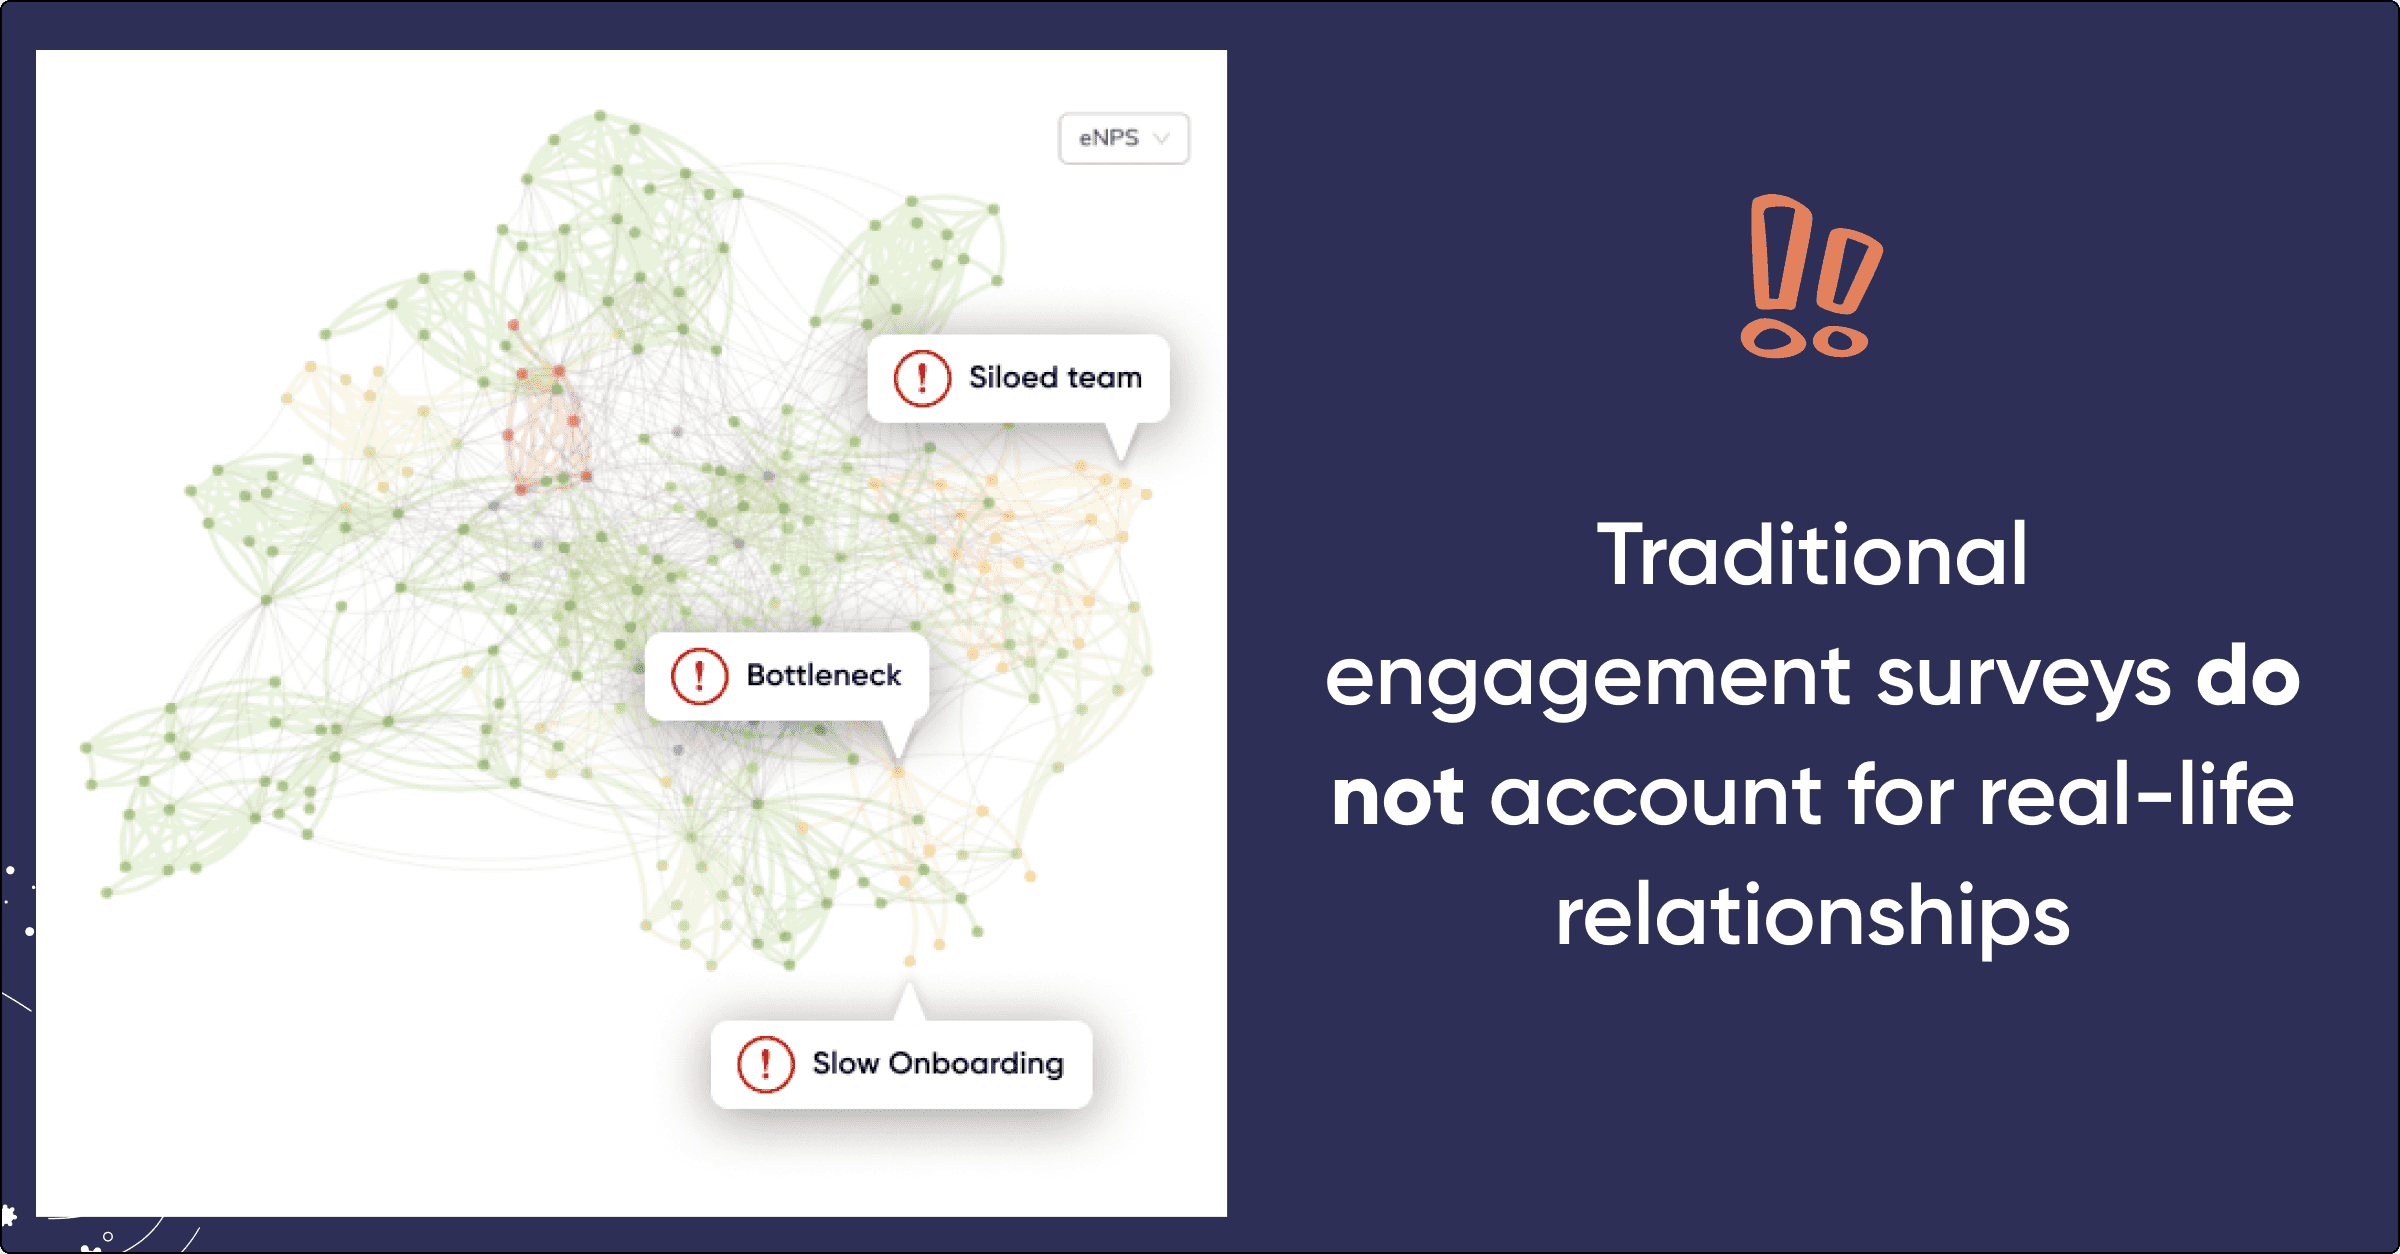
Traditional management approaches often miss the human bottlenecks that slow everything down. ONA reveals these hidden friction points by showing where information gets stuck, which individuals are overwhelmed with connection requests, and where collaboration breaks down between teams.
Supporting Strategic Workforce Planning
ONA reveals which roles are truly critical to organizational function. It’s not always the roles you’d expect. Sometimes, the most connected person in a department is an individual contributor who serves as a knowledge hub. Other times, it’s a coordinator who facilitates between groups but doesn’t appear important on paper.
This insight helps organizations make better decisions about succession planning, hiring priorities, and organizational design. Instead of planning based on assumptions, you can plan based on actual collaboration patterns and influence networks.
Types of Organizational Network Analysis
Organizations have two primary approaches to gathering network data, each with distinct advantages and use cases.
Active ONA (Survey-Based)
Active ONA involves conducting surveys that typically take about 8 minutes for employees to complete. These surveys provide deep insights into three critical network types:
- Expertise Networks: Who has knowledge and skills that others rely on
- Leadership Networks: Who influences decisions and provides direction
- Culture Networks: Who embodies and spreads organizational values
This method works particularly well when you need detailed insights into specific aspects of collaboration or when passive data sources aren’t available.
Passive ONA (Survey-less)
Passive ONA analyzes collaboration patterns through existing data sources without requiring employee input. This approach connects to communication platforms, calendar systems, and other tools your organization already uses.
The major advantage is that the analysis can be completed in about 30 minutes once data sources are connected. There’s no survey fatigue, no waiting for responses, and no disruption to daily work. You can analyze the entire organization or focus on specific deliverables or departments as needed.
Passive ONA is particularly valuable for ongoing monitoring, allowing organizational units to order analyses for their own purposes without major overhead. It provides a continuous pulse on collaboration health rather than periodic snapshots.
Combining Both Approaches
The most comprehensive ONA implementations combine both active and passive methods. Passive data provides the foundational collaboration patterns and ongoing monitoring, while targeted surveys add context about expertise, trust, and cultural dimensions that can’t be captured through communication data alone.
Key Metrics and KPIs in ONA
Effective ONA relies on specific metrics that translate network patterns into actionable business insights. Here are the key performance indicators that matter most:
Leadership Distance
This metric measures what percentage of your organization sits within two steps of the executive team. A healthy range typically shows 85-90% of employees within two network steps of leadership. If this number is low, it indicates that leadership is isolated from the broader organization, which can slow decision-making and reduce alignment.
Burnout Risks
This identifies individuals under high network demand. While the typical range for high-demand individuals is 22-32 people, some companies see numbers as high as 44, indicating potential burnout risks. These people become bottlenecks and are at risk of leaving, which could fragment organizational performance.
Silo Index
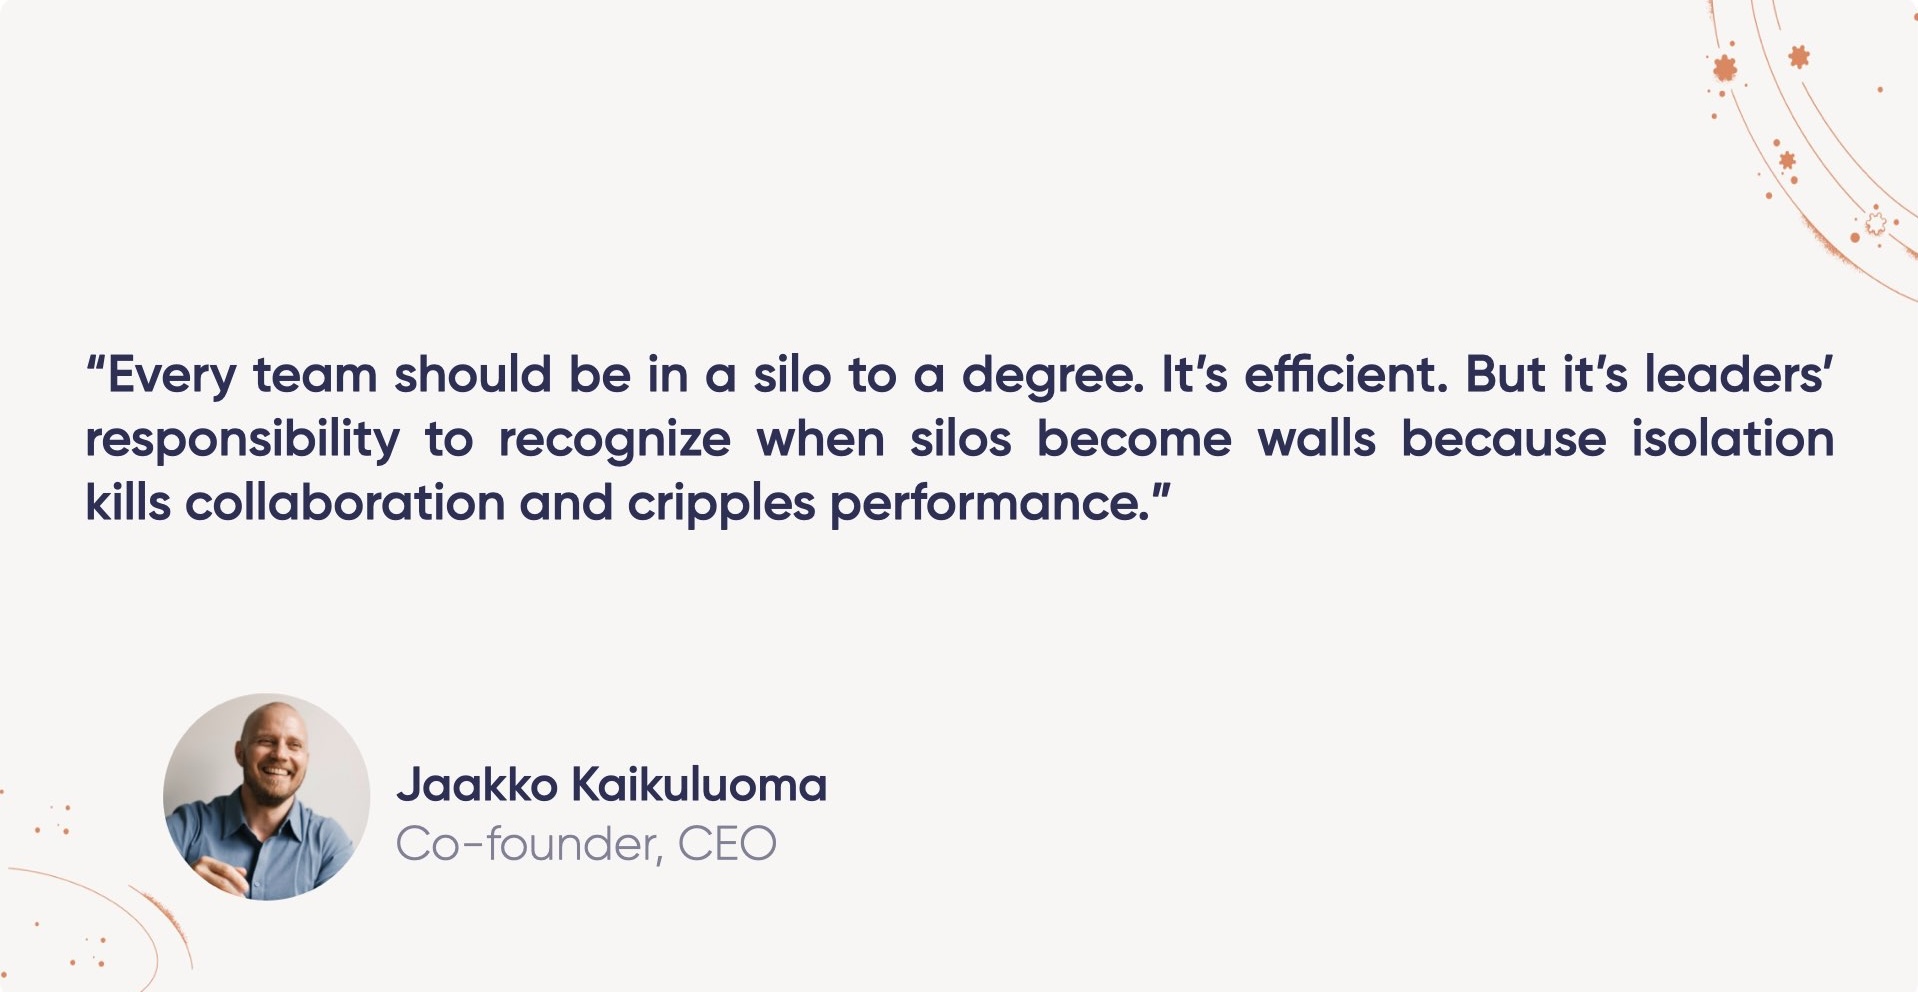
This measures the percentage of teams that are detached from the rest of the organization. A healthy organization typically shows 4-8% of teams with limited external connections. Higher numbers indicate problematic silos that slow down information flow and collaboration.
Bottleneck Risks
This metric identifies individuals who serve as the only connectors between two groups. The typical range is 8-15 critical connectors in most organizations. Too few indicates over-reliance on specific individuals; too many suggests unclear organizational structure.
Team Collaboration Style
This measures the percentage of teams that collaborate actively across departmental boundaries versus those that focus primarily on internal collaboration. Both styles can be healthy depending on the team’s function, but misalignment with culture can indicate problems.
Benchmarking Your Organization
These metrics become most valuable when compared against industry benchmarks and tracked over time. What matters isn’t just the absolute numbers, but how they change in response to organizational initiatives and how they compare to similar organizations in your industry.
Common ONA Use Cases and Applications
Based on my experience, ONA applications fall into eight primary use case areas, each addressing specific business challenges:
1. Change Management
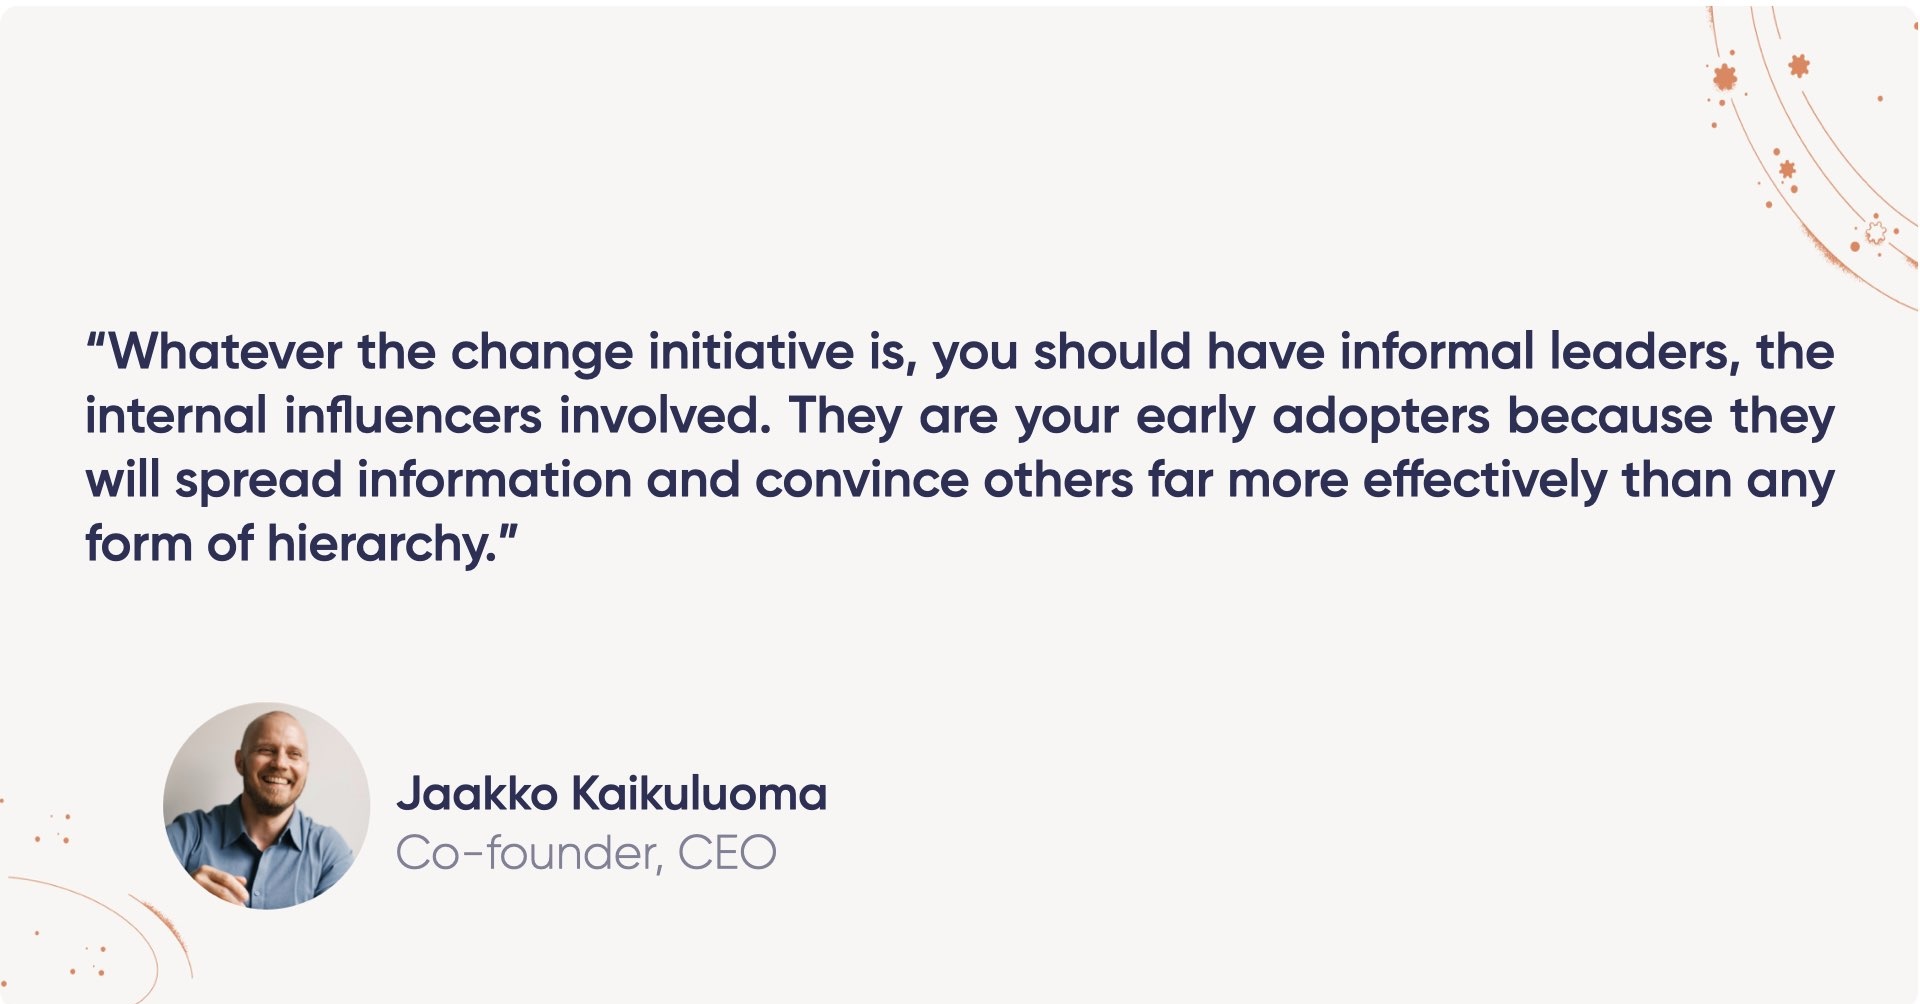
This is the most common and well-documented use case for ONA. Whatever the change initiative, whether it’s digital transformation, cultural change, or process improvement, you need internal influencers involved as early adopters. These people spread information and convince others far more effectively than a formal hierarchy alone.
2. Organizational Development
This category focuses on how different parts of the organization work together and what role each person plays in collaboration. You can map business processes or customer journeys onto the network to see how departments actually collaborate versus how they should collaborate.
Are people filling the roles they should in transferring information from sales to marketing, or product to engineering? Many organizational issues can be explained through the lack of collaboration and connection between certain functions.
3. Succession Planning
ONA helps identify future potential leaders through analyzing connection patterns and influence networks. Sometimes the best successor isn’t the most senior person, but the individual who already has the trust and connections needed to be effective in a leadership role.
4. Leadership Development
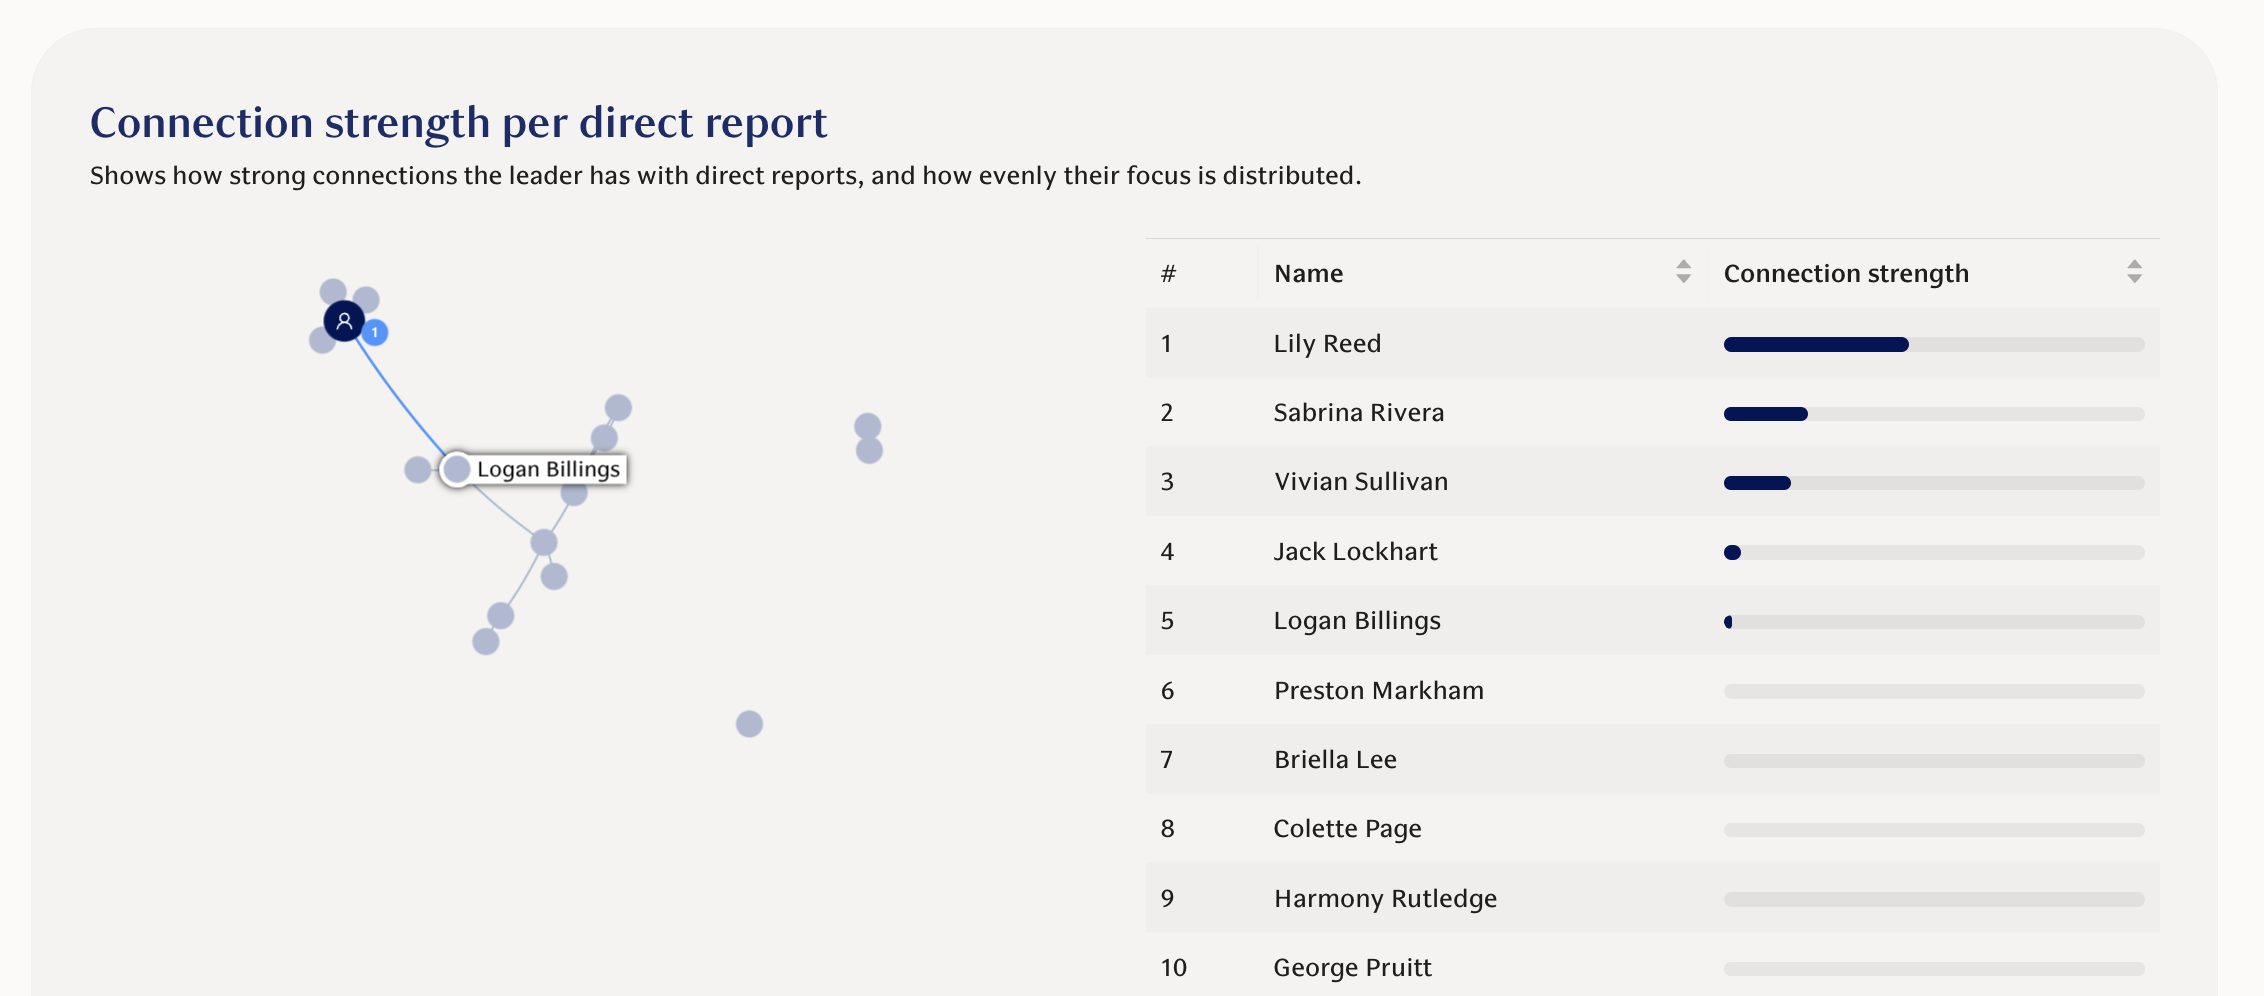
You can see if leaders are actually working in the right position or focusing their attention in entirely different ways than planned. Some leaders spend all their time managing up while neglecting their teams; others get buried in internal team dynamics and lose connection to broader organizational priorities.
5. Onboarding Support
Network analysis can support onboarding by connecting new hires with people who know how operations work and can serve as onboarding buddies. You can strategically connect newcomers with well-connected individuals who can accelerate their integration.
6. Automated Feedback Systems
Based on network connections, you can identify who would be the best people to give feedback. This creates more meaningful 360 reviews and developmental conversations because feedback always comes from close colleagues.
7. Employee Wellbeing Analysis
You can analyze how much network demand each person faces, which correlates with overload and burnout. You can also see how people in hybrid work environments maintain connections and identify those who might be isolated.
8. Influence and Inclusion Analysis
This involves comparing how different groups of people connect with management and what kind of roles they have access to. It can reveal unconscious bias in networking patterns and help ensure that advancement opportunities are accessible to all employees.
The same network dataset supports all these use cases, making ONA a particularly rich analytical approach compared to more narrow HR metrics that address only specific problems.
ONA’s Complementary Role in Workforce Analytics
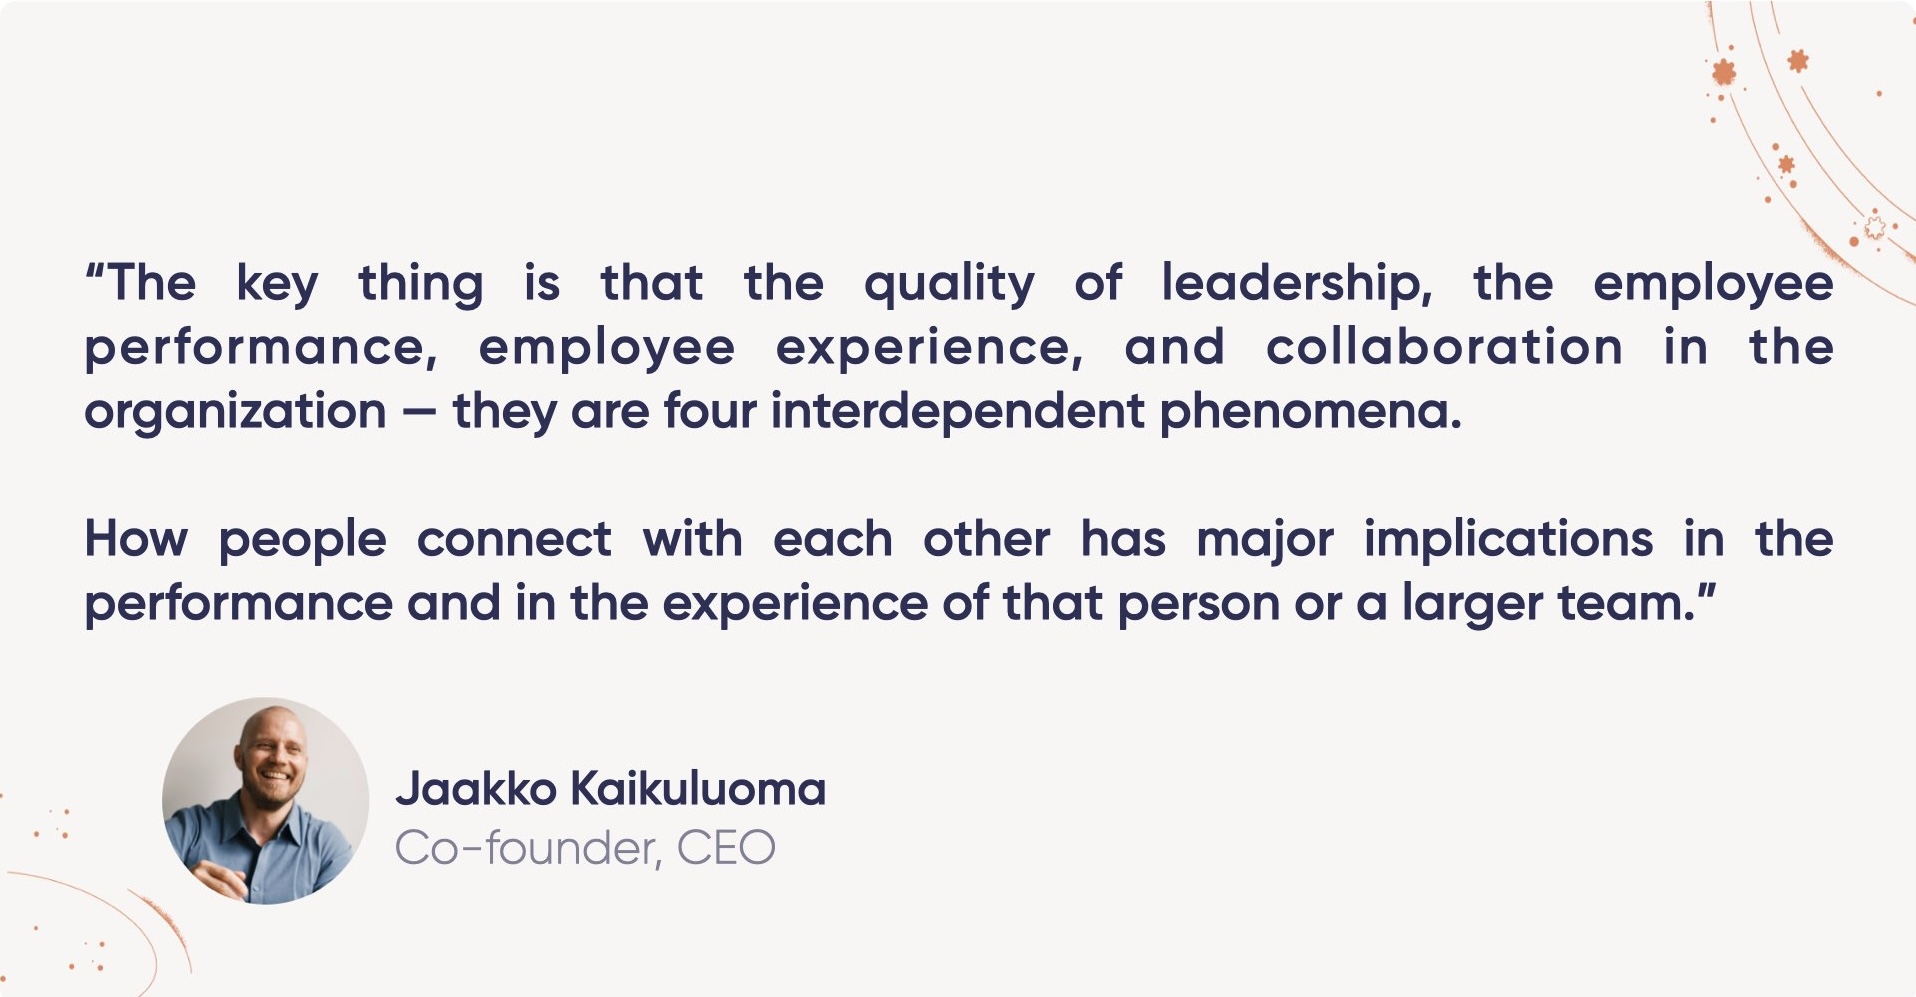
One of the most powerful aspects of organizational network analysis is how it enhances other workforce analytics tools. The key insight is that leadership quality, employee performance, employee experience, and collaboration are four interdependent phenomena.
The Interconnected Nature of Workforce Metrics
Traditional HR analytics often treat different metrics in isolation: engagement scores, performance ratings, turnover data, and productivity measures. ONA reveals the underlying collaboration patterns that influence all these outcomes. You might discover that performance issues are, in fact, due to low connectivity rather than individual skills. Enabling leaders and people managers with this data can help address the issues right on the spot.
Why Engagement Issues Often Stem from Collaboration Patterns
Consider a common scenario: engagement survey results show declining satisfaction in a particular department, but exit interviews don’t reveal clear patterns. ONA can uncover the root cause by showing whether people feel isolated, whether they have access to informal networks,
Facilitating Knowledge Retention
Organizational collaboration can be fragile. Losing just one person may create a cascade effect. This is particularly critical for understanding retention risks and succession planning.
When a well-connected employee leaves, they don’t just take their individual contribution with them. They take relationships, informal knowledge-sharing channels, and often the connections that helped other people do their jobs effectively. ONA helps identify these critical connectors before they leave and develop strategies to preserve important network functions.
Combining ONA with Performance Management Data
When you combine network analysis with performance data, powerful insights emerge. High performers who are poorly connected might be at risk of leaving or burning out. Average performers might improve dramatically with better connections to expertise networks or mentoring relationships.
This combination also helps identify whether performance issues are individual or systemic. If multiple people in similar network positions struggle with performance, the problem might be structural rather than individual.
Using Collaboration Insights to Inform Talent Development
Instead of generic leadership development programs, you can create targeted interventions based on people’s actual network positions and influence patterns.
For someone who’s technically excellent but poorly connected, development might focus on relationship building and cross-functional collaboration. For someone who’s already well-connected, development might focus on leveraging their network position for greater organizational impact.
Creating a Holistic View of Organizational Health
The ultimate goal is to create a comprehensive dashboard that shows how collaboration patterns, engagement levels, performance metrics, and business outcomes interact. This holistic view enables more sophisticated workforce planning and intervention strategies.
Instead of reacting to symptoms (low engagement, high turnover, missed deadlines), you can address root causes in the collaboration networks that underlie these outcomes. This proactive approach is far more effective than traditional reactive HR interventions.
How to Implement ONA in Your Organization
Fortunately, modern tools make the process of collecting data and running the analysis very simple. Here are the steps you should follow if you want to succeed with ONA implementation:
Step 1: Define Your Objectives
Start by clearly identifying what you want to achieve with ONA. Common goals include:
- reducing silos
- identifying bottlenecks
- improving collaboration
- supporting change management
- or developing leaders.
Your objectives should align with broader business outcomes and connect to measurable impact.
Be specific about your success metrics. Are you trying to reduce the time it takes to complete cross-functional projects? Improve employee engagement scores? Increase the success rate of change initiatives? Clear objectives help focus your analysis and measure results.
Step 2: Choose Your Methodology
Decide between active surveys, passive data analysis, or a combination of both based on your objectives and organizational context. Consider factors like:
- How quickly you need results
- Whether you need ongoing monitoring or point-in-time analysis
- Privacy and cultural considerations in your organization
- The specific insights you’re seeking (expertise networks, communication patterns, etc.)
- Available data sources and technical capabilities
Step 3: Data Collection and Analysis
For passive analysis, connect to your existing communication platforms: Slack, Microsoft Teams, Google Calendar, Outlook, and other collaboration tools. Modern ONA platforms can analyze millions of data points from these sources to map connection patterns.
For survey-based analysis, design questions that capture the specific network relationships you need to understand. Keep surveys focused and respect employees’ time. Most effective ONA surveys take 6-12 minutes to complete.
Step 4: Interpreting Results
Network visualizations can be overwhelming at first, so focus on the key metrics that relate to your objectives. Look for patterns like:
- Isolated groups or individuals
- Overloaded connectors
- Missing connections between groups that should collaborate
- Informal leaders who don’t appear on the org chart
- Bottlenecks that slow information flow
Step 5: Taking Action
Having great analysis is not the same as acting on insights. Design targeted interventions based on your findings:
- Rotate people to improve connectivity between groups
- Create new meeting practices or collaboration structures
- Develop informal leaders you’ve identified
- Address overload issues before they lead to burnout
- Establish connections between siloed groups
Measure impact over time to ensure your interventions are working and adjust your approach based on results.
ONA Success Story: Breaking Down Silos
I worked with a consulting business that had two groups of employees: technical experts and software engineers on one side, and designers on the other. The design group was experiencing high employee turnover and very low engagement scores. They had lost some of their most valuable employees, and management had no idea what was going on.
We ran an ONA analysis and quickly discovered the root cause. The management team had focused all their attention on software engineers because they were identified as critical employees. However, this focus came at the expense of the designers, who had become a silo in the organization.
The designers didn’t have any direct links to the executive team because the executive team was surrounded by software engineers. There was literally a “donut” of technical people around leadership, blocking designer access. This isolation led to feeling undervalued, uninformed about strategic decisions, and ultimately to departures.
The cost was substantial – probably hundreds of thousands, if not millions, to fix because they lost some of their best talent and needed a complete reorganization. They divided the organization into business units rather than competence groups, ensuring that each unit had both technical and design capabilities with direct leadership access.
ONA Technology: Traditional vs. Modern Approaches
The landscape for conducting organizational network analysis has evolved dramatically, with clear differences between traditional consulting-heavy approaches and modern technology-enabled solutions.
Traditional Consultancy-Based Approach
Historically, organizations would hire specialized consultants to conduct research, interview people about collaboration patterns, and manually analyze the results. This approach typically involved:
- Months of planning and data collection (3-6 months for comprehensive results)
- Expensive external consultants required throughout the process
- Manual survey distribution and analysis
- Static snapshots rather than continuous insights
- Limited scalability for regular analysis
- Narrow focus on parts of the organization as opposed to the organization as a whole
While this approach can unearth surprising insights through qualitative research, it’s a costly and time-consuming manual endeavor.
Modern Technology-Enabled Approach
Modern ONA platforms have transformed this landscape. With the right technology, comprehensive network analysis can be completed in approximately 30 minutes. This represents a fundamental shift from the traditional model:
- Automated data collection through platform integrations
- 30-minute analysis with passive data sources versus 3-6 months traditionally
- Continuous monitoring capabilities rather than annual snapshots
- Real-time insights and recommendations
- In-house execution without external dependencies
- Significantly lower costs and higher frequency of analysis
Key Technology Components
Modern ONA solutions incorporate several technological capabilities:
- Platform Integrations: Direct connections to Slack, Microsoft Teams, Google Calendar, Outlook, and other collaboration tools that organizations already use.
- AI-Powered Analysis: Machine learning algorithms that can identify patterns, anomalies, and trends in collaboration data.
- Automated Reporting: Real-time dashboards and visualizations that make complex network data accessible to leaders without technical expertise.
- Privacy-First Processing: Advanced data handling that protects individual privacy.
- Mobile Accessibility: Analysis and insights available to distributed teams regardless of location or device.
The shift from traditional to modern approaches has made ONA accessible to organizations that previously couldn’t justify the cost and time investment, democratizing access to these powerful organizational insights.
Best Practices for ONA
Getting ONA right requires more than just good technology. Here are the practices that separate successful ONA initiatives from failed ones.
Ensuring Employee Privacy and Trust
Privacy considerations are paramount in any ONA initiative. The key is transparency. Inform employees that you’re using calendar data, communication patterns, or other collaboration data to analyze organizational networks. The good news is that ONA represents a legitimate business interest. You can provide additional context about specific goals, but the fundamental requirement is simply informing people that ONA is taking place.
For survey-based ONA, privacy is more straightforward since employees provide data voluntarily and can give explicit consent. However, maintaining anonymity in reporting and ensuring that individual network positions can’t be used punitively is crucial for maintaining trust.
Communicating Purpose and Benefits
Successful ONA initiatives require clear communication about why the analysis is happening and how it will benefit both the organization and individual employees. Help people understand that you’re trying to improve collaboration, not judge performance.
Share examples of positive outcomes from network analysis: better onboarding experiences, more effective change management, and reduced silos that frustrate daily work. When employees see ONA as a tool to make their work life better, they’re more likely to engage constructively with the process.
Regular vs. One-Time Analysis
While one-time ONA can provide valuable insights, the real power comes from regular monitoring. Collaboration patterns change constantly due to new hires, departures, project shifts, and organizational changes. Regular analysis helps you spot trends, measure the impact of interventions, and catch problems before they become critical.
Combining Quantitative Data with Qualitative Insights
Network data tells you what is happening, but often you need additional context to understand why. Combine ONA metrics with focus groups, interviews, or targeted surveys to add depth to your analysis.
Avoiding Analysis Paralysis
ONA can generate overwhelming amounts of data and insights. Focus on the metrics and patterns that directly relate to your business objectives. It’s better to act on a few key insights than to get stuck trying to analyze every possible pattern.
Common Challenges in Implementing ONA and How to Overcome Them
Here are the most common obstacles I see in ONA implementation and proven strategies to overcome them.
Low Survey Response Rates
When using active ONA methods, response rates can be challenging. Combat this by:
- Keeping surveys short and focused (6-12 minutes maximum)
- Clearly communicating the purpose and benefits
- Having leadership visibly support the initiative
- Sharing results back with participants
- Timing surveys to avoid busy periods or survey fatigue
Privacy Concerns from Employees
Address privacy concerns proactively:
- Be transparent about what data is collected and how it’s used
- Explain the business rationale and employee benefits
- Ensure that individual data isn’t used for performance evaluation
- Consider anonymous survey options for sensitive topics
- Provide opt-out mechanisms where legally possible
Acting on Insights Effectively
Many organizations struggle with the gap between analysis and action:
- Develop specific intervention plans before starting analysis
- Assign clear ownership for implementing changes
- Start with pilot programs to test approaches
- Measure impact to validate interventions
- Create feedback loops to adjust strategies based on results
Sustaining Changes Over Time
Network interventions require ongoing attention:
- Build new collaboration patterns into regular processes
- Monitor networks regularly to catch regression
- Celebrate successes to reinforce new behaviors
- Address organizational changes that might disrupt networks
- Develop internal capabilities to maintain momentum
Building Leadership Buy-In
ONA is still a relatively new approach for many organizations, which can make it challenging to get leadership support:
- Start with clear business problems that ONA can address
- Provide examples of similar organizations achieving results
- Propose pilot programs with measurable outcomes
- Connect network insights to business metrics leaders care about
- Demonstrate ROI through before-and-after analysis
The biggest hurdle is often getting internal approval for ONA initiatives since it’s not yet a household analysis type. Help champions create strong proposals that clearly communicate the value proposition and expected return on investment.
Conclusion
Organizational network analysis represents a fundamental shift in how we understand and optimize workplace performance. While traditional management approaches focus on formal structures and individual metrics, ONA reveals the hidden collaboration patterns that actually determine organizational success.
The key is to start with understanding your current collaboration patterns. Make ONA a regular practice rather than a one-time analysis, since collaboration patterns change constantly and require ongoing monitoring.
Organizational network analysis gives you the tools to master the invisible art of collaboration. Ready to see your organization’s hidden networks?** Book a demo with our experts** and discover how our leadership enablement platform can reveal collaboration patterns, identify super-connectors, and provide actionable insights for your leaders in just 30 minutes.


