Leaders seeking to measure their organizational health often turn to eNPS benchmarks as a compass. When you understand how your Employee Net Promoter Score stacks up against industry standards, you gain clarity on where your leadership truly stands. This guide breaks down what eNPS is, what constitutes good eNPS benchmarks, and how the right leadership platform can help you boost this vital metric.
What is eNPS and how to calculate it?
The Employee Net Promoter Score (eNPS) is a widely-adopted indicator of employee experience and sentiment. It is derived from the NPS score, which is a similar recommendation-oriented metric for customer satisfaction.
eNPS benchmark is based on a simple question: “On a scale from 0-10, how likely are you to recommend your organisation as a good place to work?”
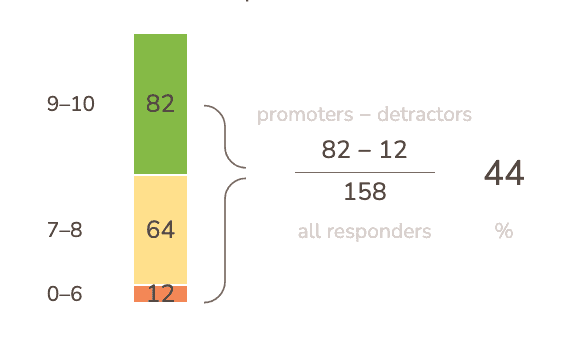
The actual eNPS score, though, is not just an average of these answers. Instead, it indicates the percentage of “promoting” minus the percentage of “detracting” employees. “Promoters” are those answering with a 9 or 10. “Detractors” are those who respond with a score lower than 7. Other responses are only counted in the total sum of responses.
Hence, possible Employee Net Promoter Scores range from -100 to 100.
What is a good eNPS?
What defines a good eNPS benchmark? While typical eNPS benchmarks vary across industries and company sizes, scores between 10-30 generally indicate healthy employee sentiment. Financial services companies often reach eNPS benchmarks of 15-25, while tech companies typically achieve 20-40. The top 10% of organizations across all sectors maintain eNPS benchmarks above 50, demonstrating exceptional leadership effectiveness.
However, the eNPS tool doesn’t really tell you what to do. A low eNPS doesn’t explain what is wrong. It can be very frustrating to see a declining score and not to understand how it can be improved.
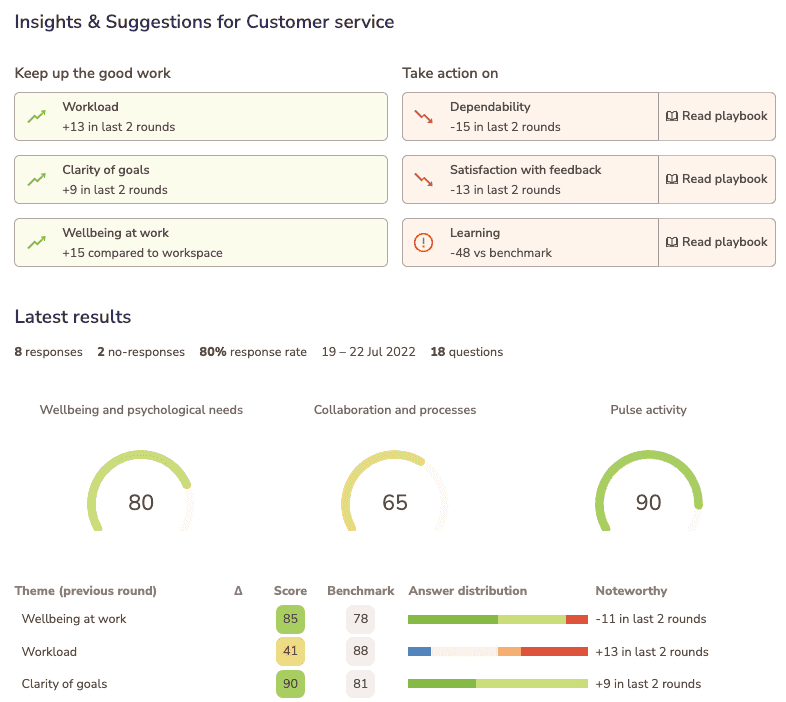
At Teamspective, we have made it easy for managers to measure their eNPS and to understand which factors might be behind declines or increases in this crucial metric.
The infographic at the top of this blog shows the 8 KPIs that best predict an organisation's eNPS grouped under 3 top-level KPIs. Let’s look at these metrics and their meaning in more detail!
Top-level KPIs that affect your eNPS score
Scientific research is the foundation of Teamspective's solutions. In order to help our customers make data-driven decisions to improve wellbeing and team collaboration, we've studied extensively the factors affecting employee perceptions and performance.
Here are the 3 top-level KPIs that impact eNPS:
1. Employee Engagement
The Employee Engagement KPI measures themes such as collaboration, motivation, company alignment and personal development. As you can see on the graph, the majority of factors influencing eNPS score are sub-KPIs of employee engagement.
2. Employee Wellbeing
Mental wellbeing, social wellbeing, safety and workload – this is what employee wellbeing is about. Neglecting people’s wellbeing increases risks of employee churn and burnout.
3. DEI (Diversity, Equity, Inclusion)
Diverse organisations are more productive and innovative. However, just increasing diversity without inclusion and equity easily leads to segregation and conflicts. Failing to create a safe, supportive, and engaging workplace is quickly reflected in your eNPS score.
The 8 Sub-KPIs that explain you eNPS score
The above three are broad, aggregated KPIs, composed of multiple themes that can be measured separately. Paying attention to these sub-KPIs helps you craft a more effective action plan.
Our research has shown that 8 of these sub-KPIs predict 56% of positive and negative changes in eNPS. In the order of significance, they are:
- Motivation
- Fairness
- Learning
- Clarity of goals
- Help and support
- Workload
- Dependability
- Psychological safety
The first three KPIs have the strongest effect on the eNPS. It means that possible fluctuations in either direction would likely noticeably change the eNPS.
Clarity of goals, help and support, as well as workload are the next most significant influencers. A low score in any of these can significantly bring down the eNPS while a higher score strongly supports success.
Though last on this list, you cannot afford to ignore dependability and psychological safety. Understanding them helps improve overall employee satisfaction and support your work towards long-term success (e.g. Google found psychological safety to be the most important factor for effective teamwork).
How Teamspective helps leaders exceed eNPS Benchmarks
Teamspective's Leadership Enablement Platform goes beyond simple eNPS tracking. It helps every manager take data-informed actions that directly impact their team's engagement factors. By combining engagement metrics with collaboration insights, Teamspective gives leaders a complete picture of team health and clear direction on how to improve.
Our platform approaches leadership enablement through three critical components:
- Collect and combine data. Teamspective automatically combines employee engagement data with organizational information, creating a comprehensive understanding with zero leader work.
- Identify and prioritize insights. The platform analyzes your eNPS benchmark and its drivers, highlighting the specific areas each leader should focus on for maximum impact.
- Take actions leaders have time for. Teamspective recommends tailored, practical actions based on your specific eNPS drivers, enabling every leader to deliver meaningful improvements.
Our research shows that in 83% of cases, the solutions needed to improve eNPS benchmarks should be team-focused rather than company-wide initiatives. That's why Teamspective encourages each team to establish routines for analyzing and addressing pulse results, with easy access to data and actionable recommendations.
Ready to elevate your eNPS benchmark with Teamspective's Leadership Enablement Platform? Get in touch with us today.


